Data-based recruiting - KPIs in the area attract & recruit
The main reason companies are not taking full advantage of their talent hiring opportunities is that many HR departments do not have a consistent mechanism for attracting the right candidates to get them excited about jobs in their company – before they even apply for a position. Talent acquisition without recruitment marketing can be equated to a couple getting married without ever having spent a first or second date together. By ignoring the pre-application phase in recruitment (attract) and the KPIs that can be measured and optimized here, companies are unable to improve the candidate experience, reach more qualified candidates and successfully compete against the competition for talent.
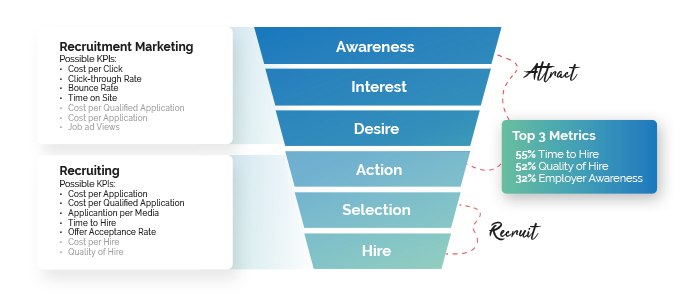
Talent acquisition and the associated collection and optimization of data begins before a candidate even knows they want a new job. Nevertheless, for many companies, talent acquisition only begins when a candidate actively applies for a position, and it is at this point that most data is measured today (recruit area). Several studies show that recruiters primarily measure time-to-hire and quality-of-hire.
But what about the data before that? Recruiters post a job ad and then … wait. They wait for the perfect candidate to magically find their way to the company and apply. This ‘post-and-pray’ model is doomed to fail on both the company and candidate sides. According to a study conducted by McKinsey & Company, 40% of companies planning to hire next year said they have had vacancies for six months or more because they can’t find qualified candidates. For Talent Acquisition to be effective, recruitment must begin long before a candidate applies. It must begin, be measured and optimized before that person knows they want a new job. But most companies don’t really have an idea of what data can even be measured and optimized before Recruit, in Attract.
Attract
How many candidates have seen my job offer? This simple-sounding question is asked by many recruiters over the duration of their recruitment campaign. Job Ad Views refer to the number of views that your placed ad/campaign attracts on the various media used. Many providers can certainly deliver this metric on request, unfortunately, this score only tells a small part of the story.
In recruitment, the cost per click (CPC) KPI describes the cost per click for a recruitment campaign across all media or for each individual channel. The CPC is determined by dividing the total use of the media in € by the total number of clicks achieved on the job ad. For example, if you spent €3,500 on the recruitment campaign and received 80 clicks, your cost-per-click is €43.75. However, this is a quantitative KPI that can vary greatly depending on the complexity and narrowness of the target group. Nevertheless, it makes sense to keep an eye on this KPI, especially if you recruit different profiles more frequently. Then it often also makes sense to survey the cost-per-click for a specific job board in order to keep an eye on the performance for your target group on this medium and to be able to react to changing access figures.
The click-through rate, for example, relates the number of views of an ad to the number of clicks on it. How many visitors saw your ad on Facebook or a job board and how many then clicked on it and read through it further? Or how many applicants read your job ad and then clicked on the ‘Apply Now’ button? If your job ad was viewed 100 times and clicked 5 times, your CTR is 5%.
In the field of web analytics, the bounce rate refers to the percentage of visitors to a website who leave the page again without calling up another sub-page of the respective domain. In practice: a potential applicant lands on your career page, but doesn’t click on anything on it / doesn’t perform any action there and leaves the page again. The bounce rate is calculated by, for example, dividing the visitors to your career page with only one page view by all visitors to the page. The bounce rate should be considered a measure of the visit quality of your candidates: A high bounce rate in the career page or landing page example usually indicates that candidates view various items as unappealing or content as irrelevant. To positively influence the bounce rate, you can work on the following points: A faster load time, mobile optimization, an appealing and high-quality design, easy navigation, and providing relevant content. However, the bounce rate is also influenced by factors such as the source and medium of the visit (e.g. via a search engine) or the fact that the candidate may have already found all the relevant information he needed when he accessed the page and therefore left it again immediately. A free and easy way to measure the bounce rate of a website is offered by Similar Web.
Time on site refers to the time a visitor spends on a page. In practice, this could measure the time a candidate spends reading your job ad or the time a candidate spends on your career page or landing page on average. If candidates bounce after only 3 seconds, you should take another closer look at your job ad in terms of structure, content and also layout, Tip: Eye tracking is a great way to measure in real time how the candidate’s gaze passes over your job ad. Which areas are attractive and increase the dwell time and which areas still need optimization?
Recruit
How many candidates have seen my job posting? This simple-sounding question is asked by many recruiters about the duration of their recruiting campaign. Job ad views refer to the number of views your ad/campaign received on the various recruiting channels. The Cost per Application (CPA) metric is used to determine the cost per incoming application for a recruiting campaign or for a single medium.
If you spent €3,500 on your recruitment campaign and received 40 applications, your CPA is €87.50.
The (Qualified) Applications per Medium (APM/QAPM) metric can give you qualitative or quantitative information about the performance of individual media channels by calculating how many (qualified) applications you received through a single channel. Pay attention here to the performance per media channel and position, which of course can vary depending on the employer brand, industry and work location.
Time-to-hire describes the filling time for an open position, i.e. the time from the start of the recruiting process until the new employee is hired. Here, some numbers should be measured and optimized, especially since the departure of a qualified candidate is almost the most expensive here due to slow recruiting processes (a departure after contract signing or onboarding would be even more expensive). Most candidates want a response to their application within 14 days, but currently, employers take an average of a month or longer to respond. The average time from invitation to first interview is 14 days – we then measured an average of 42 days (about 1.5 months) from receipt of application to interview. The average time to hire, the time between job posting and contract signing is 63 days. However, in some job categories, the process takes even longer (IT 87 days, Engineering 92 days) or is significantly shorter (Marketing 51 days, HR: 58 days). Source: ATS evaluation Qandidate.com/VONQ.
Offer Acceptance Rate reflects the percentage of candidates who accepted the job offer you submitted compared to all job offers submitted. This number provides insight into how attractive, trustworthy and competitive your job offer is. A low OAR should encourage you to reconsider individual factors of your offer, such as salary range, benefits, or flexibility.
Other KPI's
As you can see above, the performance of the KPIs in the attract area significantly influences the performance of the KPIs in the recruit area. This is why it is so important to adjust the KPIs in the upper area of the funnel before directly addressing well-known KPIs such as cost-per-hire, time-to-hire and quality-of-hire.
Discover the Campaign Performance Add-on feature in the Job Marketing Platform
You want to have your KPIs such as cost-per-click or cost-per-application transparently visible per job ad to know exactly which sources candidates use to find their way to your job ad and how they navigate your career page until they finally apply? Then our Campaign Performance Add-on feature in VONQs Job Marketing is exactly the right tool for you. Feel free to sign up for a personal demo. We’ll answer all your questions and show you all the functionalities live in just 30 minutes.